Analytics is a great tool for improving the relationship between content and design, but that's not all it's good for. Analytics data can also help you focus on the people who matter most – the target customers who access your site – and understand how they interact with your website and content. That understanding can be a big help in tweaking both your design and your content strategy. You can get an even better picture if you use more than one type of analytics tool.
1. Standard Analytics Tools
Google Analytics is a good starting point and it provides incredibly rich data that goes way beyond visitor numbers. If you want to keep tabs on interaction, some of the key metrics to track include the main landing pages and exit pages and the top content, but don't stop there. It's worth drilling down to deepen your understanding of web users.
One of our favorite reports is the visitors flow report, which graphically illustrates people's path through your site from the time they land on a page until the time they leave. It's color coded, too and weighted so you can easily tell where the bulk of your visitors spend their time. It's a great way to find out if your internal linking is working well or whether too many external links are making people leave the site too quickly.
It's also worth looking at metrics like the average time on page to see whether your content is sticky enough to keep people reading. And the mobile and social reports give additional insights into those interactions too.
If you like the data in Google Analytics, then also consider one of these alternatives.
2. Heatmap Analytics Tools
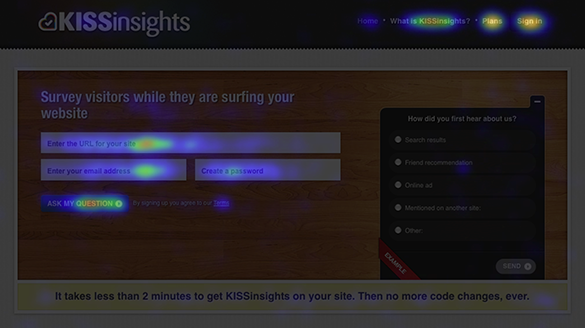
Want to do a different kind of online detective work? Then a heatmap analytics tool could be the answer. A heatmap tells you where web users spend most time on your site (the hot areas) and which areas they avoid altogether (the cool ones).
One example of a heat map analytics program is Crazy Egg who also offer scroll mapping to show which areas of your site are most viewed in a browser window. One of the most interesting features Crazy Egg provides is the "confetti" report which tracks actual mouse clicks. And there's link tracking, too.
Heatmap analytics takes the guesswork out of analyzing user actions on your site so that you can identify what's working and what's not about your content and design. 20Spokes has a useful list of heatmaps analytics tools for you to try.
3. Social Media Analytics
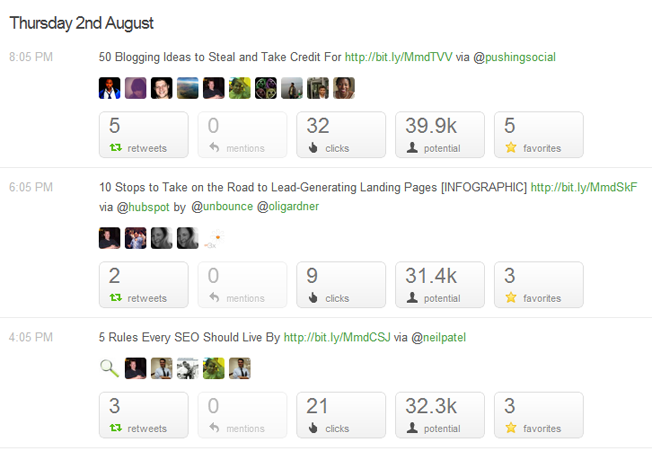
You can't do business without considering social media. That's why it's important to analyze what happens with your content when it leaves the site.
As well as headline figures on how many times your content has been shared, it's important to assess interaction, engagement, conversation, reach (further re-shares) and more. To do this effectively, you need social media analytics.
There are dozens of programs that will help you understand the social side of your business. In addition to the social reports in Google Analytics itself, you can use the analytics available in social sharing tools like Buffer and Hootsuite, a tool like SumAll or one of the apps on Venture Beat's list of social analytics apps.
Use any of these analytics tools – or, even better, all of them together – and you will know what parts of your site design and content attract users and drive content. That's the information you need to adapt your strategy to continually meet users' needs.